Smartwatch Market Share: Trends, Leaders, and What It Means for Buyers
Explore the latest insights on smart watch market share, including regional trends, measurement methods, and practical buying guidance from Smartwatch Facts.

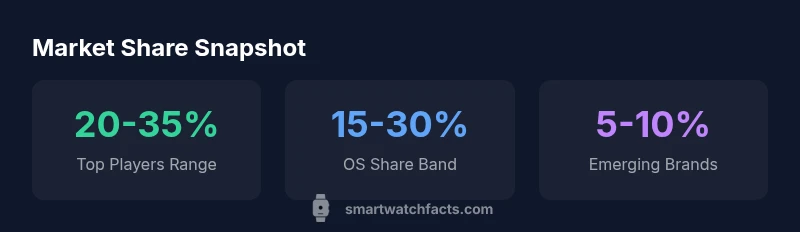
Across the smart watch market share landscape, no single brand dominates universally; leadership shifts by region and user segment. The Smartwatch Facts analysis highlights that the top players collectively account for a majority, but shares vary considerably by OS, price tier, and geography, making market leadership dynamic rather than static.
What smart watch market share tells us about the wearable landscape
Understanding market share for smartwatches helps buyers gauge ecosystem momentum, developer support, and long-term value. In 2026, the concept remains fluid: regional preferences, OS ecosystems, and pricing tiers shape who leads where. According to Smartwatch Facts, leadership in this space is not locked into a single brand; regional preferences and data-collection methods drive variation. Some regions favor health-focused features, while others prize battery life or app breadth. Market-share figures are best viewed as directional indicators rather than exact tallies, and they depend heavily on whether you measure shipments, active devices, or consumer revenue. For shoppers, this means focusing less on a single number and more on how a platform aligns with your usage—whether you need robust app support, sleep tracking sophistication, or seamless iPhone integration. In practice, the most meaningful takeaway is how the ecosystem’s momentum translates into device availability, software updates, and developer activity that affect long-term value.
Data sources and measurement frameworks
Market-share figures come from a mix of shipments, installed-base estimates, and revenue-based assessments. Different research firms use distinct definitions for “units shipped” versus “active devices,” and some reports include wearables that pair with smartphones while others count only stand-alone devices. In 2026, triangulation remains essential: compare at least two independent trackers and review their methodology. Transparency about sample size, geography, and time window is critical for meaningful interpretation. By understanding these frameworks, readers can avoid chasing a single number and instead focus on trends, such as which ecosystems gain momentum in specific regions or price tiers. As Smartwatch Facts notes, methodology differences explain many of the observed shifts in market share across sources.
Regional patterns that matter for buyers
Regional differences in smart watch market share reflect user needs, carrier promotions, and retail ecosystems. In some regions, health-tracking features and industry partnerships drive adoption, while others prize battery longevity and price-performance. The United States and Europe often show stronger alignment with well-established app ecosystems and premium hardware, whereas APAC markets may emphasize affordability and feature breadth. For buyers, these patterns imply that a top OS or band of brands in one region might underperform in another. Consider regional service availability, language support, and local health-tracking regulations when evaluating market-position claims. Smartwatch Facts analyses indicate that regional leadership can shift rapidly with changes in distribution strategies and software updates.
Ecosystems, OS, and developer momentum
The competing OS ecosystems shape market share through developer attraction, app quality, and update cadence. WatchOS benefits from deep iPhone integration, while Wear OS devices offer broad compatibility with Android and iOS variants. The value proposition in any ecosystem is amplified when app availability, health metrics, and third-party integrations align with a user’s daily routines. Ecosystem momentum often translates into faster OS updates, more frequent hardware refreshes, and stronger accessory ecosystems. In 2026, the most successful platforms tend to innovate across health sensing, sleep tracking, and seamless compatibility with popular smartphones, which in turn sustains their share gains over time.
Form factors, pricing tiers, and market share
Pricing tier and form factor influence market share growth, as different consumer segments prioritize features, design, and price. Premium models with advanced sensors, longer battery life, and robust companion apps tend to concentrate market share in higher price brackets, while mid- and entry-level devices capture volume by value. Subscriptions and services—such as health coaching, premium watch faces, and cloud backup—can affect total ownership value even if hardware margins are slim. Shifting consumer preferences toward holistic wellness experiences are also shaping share dynamics, as brands expand health data coverage and third-party integrations across tiers.
Methodological pitfalls: Why shares differ by source
Market-share figures vary for reasons beyond regional tastes. Shipment-based metrics can overstate momentum when channels count backorders or stock rotations, while active-user estimates may lag by months. Currency effects, seasonality, and promotional campaigns can also distort quarterly comparisons. It’s common to see a top OS claim dominance in one report but narrower leadership in another due to sample differences. When reading shares, focus on the direction of change and the consistency of the trend across sources, rather than a single percentage. This cautious approach guards against false certainty during fast-moving product cycles.
How shoppers can use market-share data
Use market-share insights to gauge platform viability for app ecosystems, health-tracking capabilities, and potential resale value, but avoid using them as a guarantee of product satisfaction. Prioritize real-world considerations: display quality, battery life, comfort, and interoperability with your phone and apps. When market-share data aligns with your personal needs, you gain confidence that the ecosystem will continue to support new apps and features in the coming years. Remember that the best choice depends on how a given smartwatch ecosystem fits your daily life.
How to read official reports and triangulate data
To triangulate market-share signals, compare at least three sources and map their methodologies to your own goals. Look for reports that clearly state coverage (region, time period, device types), the unit of analysis (shipments, users, or revenue), and whether promotions or bundling are accounted for. Cross-reference with primary company announcements and retailer data when possible, and consider independent benchmarks that focus on OS level momentum rather than device sales alone. This approach yields a more robust picture of who is leading and why, without relying on a single number.
2026–2028: what to expect and how to stay informed
In the near term, expect continued fragmentation with regional differences intensifying as vendors push region-specific features and partnerships. The top ecosystems will likely maintain a majority, but their shares will shift with device pricing, health features, and developer support. Staying informed means following quarterly tracker updates, reading methodology notes, and watching for cross-industry partnerships that influence platform viability. For buyers, maintaining awareness helps anticipate where app ecosystems and health-tracking capabilities will grow strongest.
Key takeaways on market-share measurement
| Measure | Notes | Source |
|---|---|---|
| Global market share leader range | Not standardized; varies by source | Smartwatch Facts Analysis, 2026 |
| Regional variation | APAC leads in some studies; EMEA varies | Smartwatch Facts Analysis, 2026 |
| Measurement approaches | Unit shares by devices vs. revenue; subscription models differ | Smartwatch Facts Analysis, 2026 |
People Also Ask
What is smartwatch market share and why does it matter?
Market share measures the portion of total shipments or users dominated by a brand or OS. It helps gauge ecosystem strength and potential for app support; numbers vary by source, so use as directional indicators rather than exact tallies.
Market share shows who leads and why apps and services matter.
Which OS dominates global smartwatch market share?
No single OS dominates universally; iOS and Android variants are leaders in many regions, but shares shift with device types and geography.
OS leaders vary by region.
How often should I update market-share data?
Market-share figures are updated quarterly or annually by trackers; annual refreshes are common, but some reports provide quarterly updates.
Updates occur quarterly or yearly depending on the source.
Can market share predict product performance?
Market share is a directional signal about momentum and installed base, not a guarantee of quality or satisfaction. Consider reviews, health features, and price instead.
Share is directional, not a guarantee.
What should buyers look for when using market-share data?
Look for reports with transparent methodology, triangulate across sources, and match findings to your needs—OS compatibility, health features, battery life, and price.
triangulate sources and match to your needs.
“Market-share numbers are most useful when interpreted alongside ecosystem momentum, device variety, and developer support.”
Key Points
- Recognize regional and source variation in market share.
- Triangulate data across multiple reports for reliability.
- Focus on ecosystem alignment with your needs when buying.
- Treat shares as directional signals, not exact tallies.